

Содержание
If you want your advertising campaign to be successful, it is important to monitor its online advertising performance indicators. Without these actions, it is impossible to control the dynamics, evaluate the costs of advertising and trace some patterns that may affect the creation of a successful advertising strategy.
Various metrics give us an understanding of where to look for the problem of lowering efficiency. In order to evaluate correctly, it is important to initially understand the ultimate goal, because this gives you the opportunity to prioritize monitoring of certain data. In this article we will describe all the metrics you need to focus on if the goals of your campaigns are cost per action or unit economics.
Goal # 1 – Cost per Action (CPA)
CPA is an indicator that shows to advertisers how much they have paid for targeted action on their site. It is calculated based on the ratio of the price paid for impressions and the resulting targeted actions. The action, in this case, can be any conversion: leads, sales, applications, subscriptions, etc. This indicator makes it clear how much the specified user action costs you.
If the CPA is the basis of our campaign analysis, it’s important to understand what exactly affects pricing. As basic indicators, we can distinguish:
- CPM
- CTR
- Conversion Rate (CR),
- cumulative frequency.
Of course, each of these parameters is affected by its own set of factors. In this article, we will also consider derivative metrics that affect the basic indicators listed above.
Cost-per-mille
CPM, or cost per thousand impressions, is a model of payment for advertising when the cost is set for 1 thousand impressions of an ad. This is the basic option that the system offers us, and which can be adjusted under the influence of a number of factors.
What are the main factors affecting CPM?
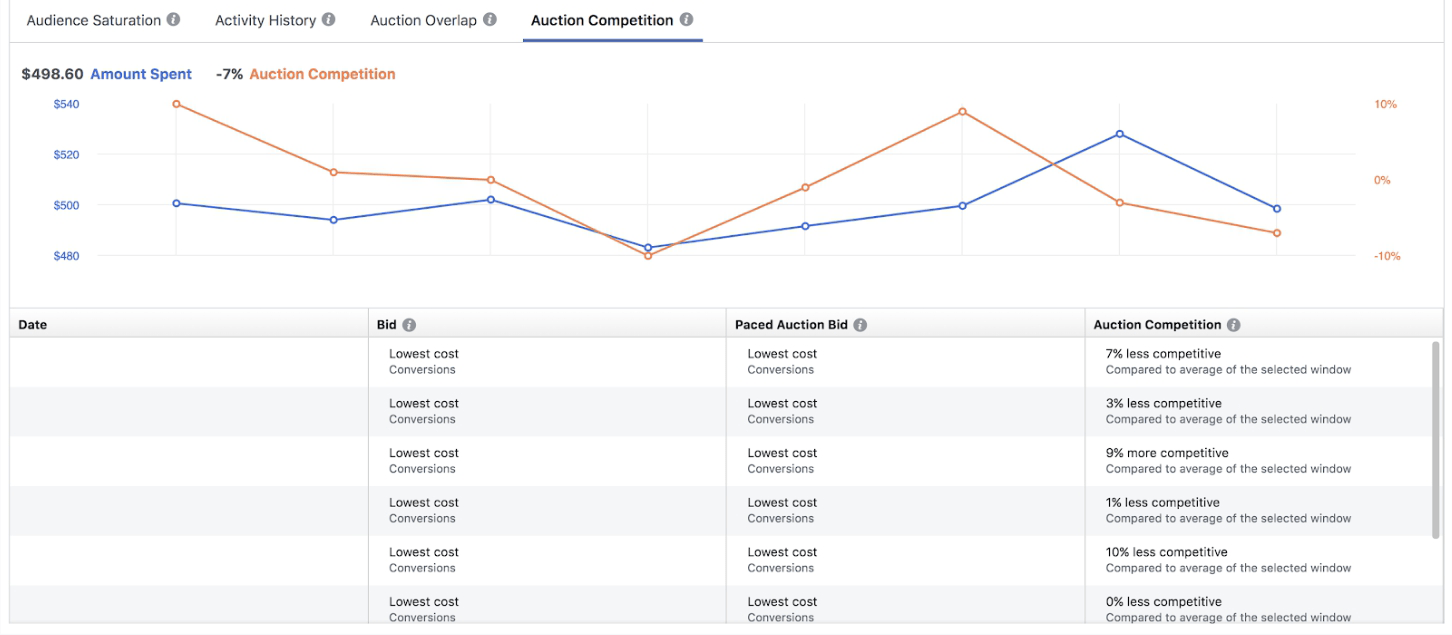
- Competition. Your ads will always compete with ads of other advertisers for the same audience, and the cost of impressions will be determined by several factors. The first is the activity of the audience in the advertising network: the more time users spend online, the more advertisements they can see, the lower the competition and cost. This is called an advertising inventory. The second is the number of advertisers, the money they are willing to spend on ad campaigns and the impressions they are willing to buy.
2. Placemen. If you display ads only on Facebook it will have another cost then both Facebook and Instagram.
3. Objective and optimization. For example, the Traffic objective, as a rule, gives cheaper CPM than the Conversion objective, if in both cases you have optimization for clicks.
4. Campaign Schedule. Ads displayed during peak periods, such as big holidays or weekends, can be more expensive.
5. Budget. A high bid allows you to buy an audience for more expensive views, and as a result, the cost of impressions increases.
6. Frequency cap: the maximum number of ad impressions per user.
7. Partial overlapping. If you run multiple campaigns for the same audience at the same time, the price for it may increase.
8. Geography. The launch of advertising in the United States will cost you much more than in India, for example.
9. Creative quality and relevance. And at this point, we will focus in more detail.
Ad Quality Ranking
Ad relevance affects the frequency of ad impressions and how much you pay. The higher the score, the lower the cost and better the results. In order to correctly track the relevance of the ads, Facebook introduced three parameters:
– assessment of the quality of the ad (in comparison with the competitive ad for the same target audience). The comparison is based on the feedback from users who viewed or hidden the ad, and the assessment of various factors that may annoy them;
– Conversion Rate Ranking. Facebook compares your ad with the competitors’, which have the same target audience and optimization goals, determining the probability that users will perform a conversion action upon seeing the ad;
– Engagement Rate Ranking. It is a comparison of the expected ad engagement rate with ads, competing for the same audience. The expected engagement rate is the probability that the user will interact with the ad: click on it, leave a comment or share.
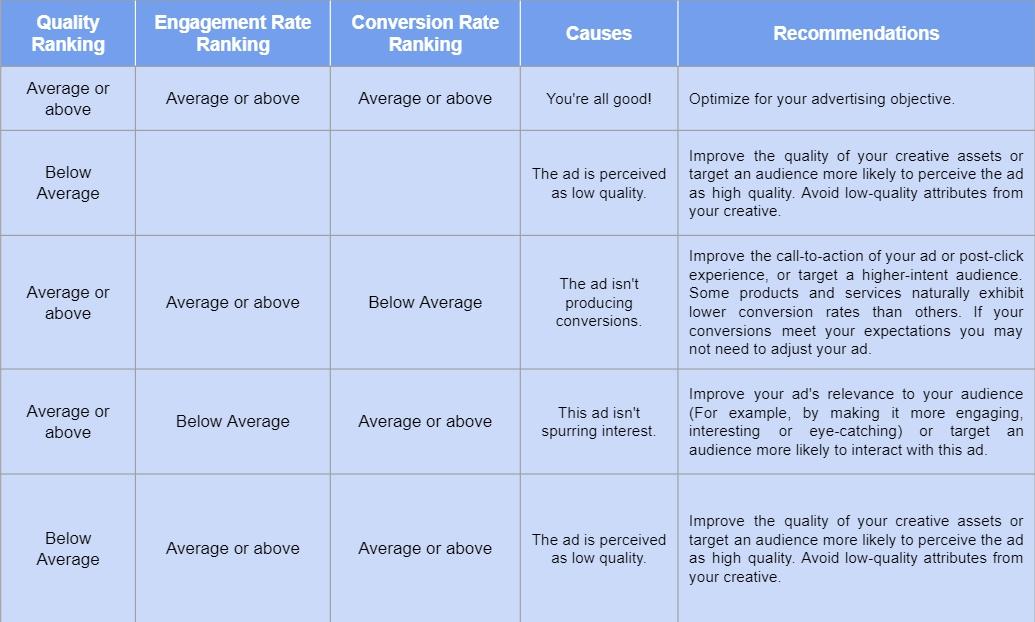
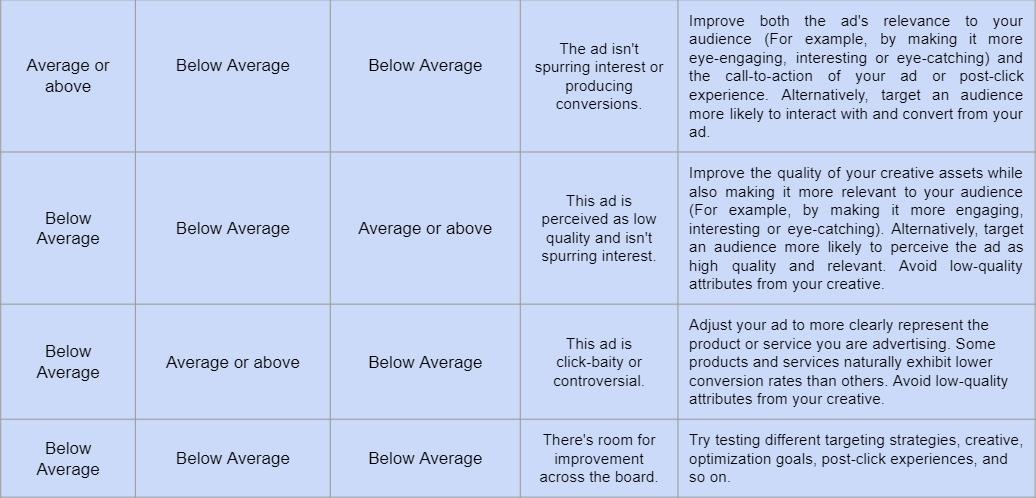
Facebook has five types of values for quality ranking:
- Above Average
- Average
- Below Average (Bottom 35% of ads)
- Below Average (Bottom 20% of ads)
- Below Average (Bottom 10% of ads)
To understand these metrics, as well as their meaning, will help the chart.
Click-through rate
Clickthrough rate or CTR is the audience’s response to your ad. This metric shows the number of clicks on an advertisement, in comparison with the number of its impressions, and affects one of the quality ad ranking indicators, about which we wrote above, namely — Engagement Rate Ranking.
It is logical that a greater number of clicks gives a higher probability of conversions, therefore, the advertiser is faced with the task of raising the click-through rate to the highest level possible, but you should be careful when evaluating this coefficient! Clickability is different for each campaign, and a high CTR is not a guarantee of effective conversions. Increased clickthrough rate can be obtained thanks to a provocative headline or a bright visual, but such traffic may not give a conversion. Users will go to the page/site/landing page and leave it without finding a relevant offer. Therefore, CTR should be evaluated in synergy with a conversion rate. Improving the clickthrough rate without increasing the number of conversions will not affect ad quality ranking in a positive way.
What affects CTR?
- Advertisements. Of course, the ad creatives should attract users’ attention, but this is not the only thing worth betting on. The right communicational strategy, type of advertising campaign, ad format, visual, text and headline can provide not only the attention of the audience but also high-quality traffic.
- The target audience. If the percentage of irrelevant views is low, then we have correct targeting and a higher click-through rate. But if the targeting is incorrect, the bounce rate is high and users leave the site just a few seconds after visiting it, then we don’t get into the audience or give meaningful communication. To see the user’s actions on the site in dynamics in order to understand why they are leaving and at what stage, you can use the Webvisor (Yandex. Metric) or the Hotjar service. If it becomes clear that everything is fine with the targeting settings and communication, but people still leave, perhaps the problem is in the product or in people (rarely), cause they may have their own reasons not to perform the target action. Then you should carry out customer development, gather people who have been active on the site but have not done anything, and conduct an interview, get first-hand information to make changes to the product or advertising campaign and begin to get results anyway.
Conversion Rate (CR)
CR or conversion rate — the ratio of the total number of users who clicked on the link of the advertisement to the number of those who completed the target action.
CR and CTR metrics should be considered inextricably from one another since only this approach will help you objectively evaluate the results of campaigns. At the beginning of the funnel, the CTR allows you to understand how many people clicked on the link in the advertisement, and the conversion rate shows the post-click actions of users who are already on the site or landing page. Considering the relationship between these two parameters, you can always understand at what stage of promotion you have gaps and what exactly should be worked on:
- If the CTR increases with the growth of CR, then you are doing everything right, and your communication strategy, targeting settings, site, and product are perfectly combined.
- If the CTR has increased, but CR is not, then you probably have communication problems, if with targeting you did everything right. The message may be ambiguous in perception or may not be relevant to the offer at the entry point, and therefore people who clicked on the ad and came to the landing page quickly leave it. The click-through rate is high, but no results level.
- If CR rises, but CTR does not, this tells about your positive work on the traffic entry point (site page, A/B testing of the site, etc.), and about the absence of parallel work on advertisements and communication in general.
- And if the CTR and CR are low, it means that a comprehensive analysis and systemic changes are needed.
What affects CR?
Since CR is the reaction of the audience, several things influence its positive dynamics: the product and the content itself at the traffic entry point. The target audience decides to make the conversion action under the influence of a number of factors. This is a popular and high-quality product, and equally quality content, user-friendly UX and UI design, high-speed downloading, etc. In addition, targeting and CTR affect the CR metric, as we have defined above, since the more people get to your site, the more conversions they can make.
Even if the price for the result is a little lower, but you observe an increase in CR and CTR indicators, then you are achieving better reactions. However, if there is a rise in price, it is worth looking, for example, on the CPM indicator. Competition or other factors could affect the result, and you can turn out that you’ve raised the quality, and the price fell for other reasons.
Cumulative frequency
Cumulative Frequency, or accumulated frequency, is a total load of ad impressions on a specific audience.
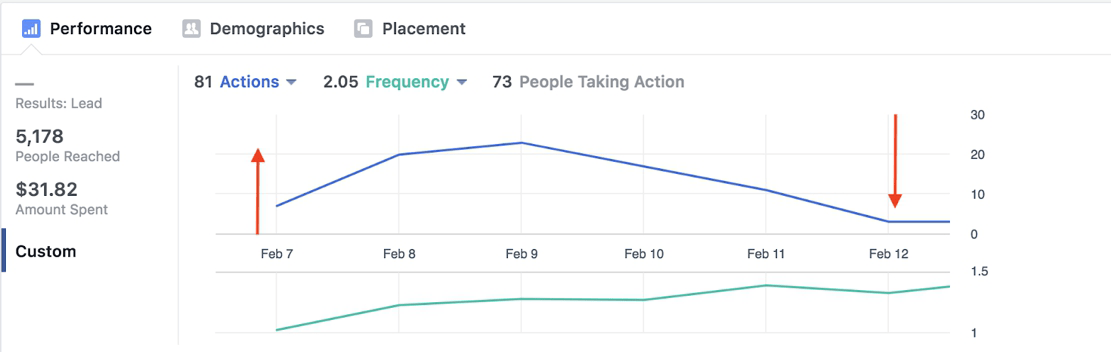
Probably you have heard about the situation when users stop seeing ads, reaching the so-called stage of satiety. At this point ads continue to be shown, the frequency increases, as does the price for the result. In order to avoid such inefficient spending of the budget, it is necessary to find the range in which the cumulative frequency increases, while the performance starts to fall. Often, a drop in performance may be preceded by a drop in interactions:
In other words, you need to find a range for optimal frequency control, reaching the point where the ad continues to be seen and it has not yet tired the audience. After the saturation stage, overpayment for excess impressions begins. It is worth remembering that each region has its own advertising clatter – the volume of advertising messages in the category per consumer. For example, in the USA and Ukraine, the advertising load is completely different, and it also differs depending on the niche within the same country. In addition, all users have individual levels of banner blindness, which also affects the increase of frequency.
In reach campaigns, the optimal frequency is determined by benchmarks or the experience of a media planner, but in conversion campaigns, the optimal frequency must be determined in dynamics. For example, if McDonald’s or KFC covers the entire audience for fast food interest, then the frequency can act as a benchmark. And if two advertisers launch conversion campaigns that cover different segments of the same audience within the same niche, it will be wrong to take the average value in this case. At least because the audience does not overlap. So we see that tracking benchmarks can be used only to reach campaigns when goals and budgets allow you to cover a significant part of the audience. In conversion campaigns, you should monitor indicators in dynamics, and if the price for the result falls and the cumulative frequency rises, adjust it in an appropriate moment.
Of course, using different creatives for the same advertisement can slow down this process, but the cumulative effect will still be visible. In order to objectively evaluate this parameter, you need to look at the report not only within the ad group, but also at the results of the entire campaign, and possibly several campaigns. It may seem to us that advertising has not yet bothered users, but when we look at all the results in the Ads Manager we see a complete picture.
What drives a cumulative frequency increase?
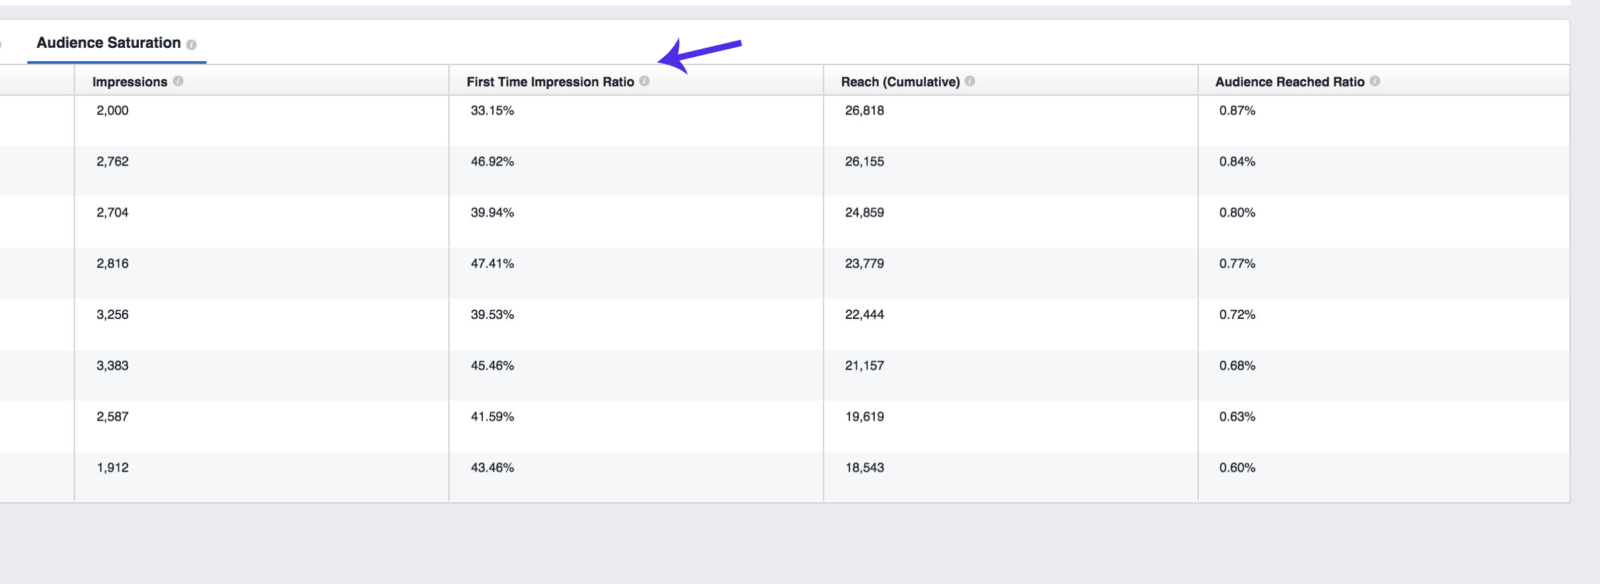
First Time Impression Ratio that can be viewed in Delivery Insights. If the frequency grows slowly, it is normal, it means that both old and new users see ads. In conversion campaigns frequency should tend to be 1, but not all people respond to advertising for the first time. Therefore, it is better to keep it at the limit level so that the audience is not fed up and try to find new people who have not yet seen your advertisement.
Even with an optimal increase in frequency, one should not forget that the audience has its limits. At some point, only those people who have already seen it will see ads, and the First Time Impression Ratio will begin to fall. This is why it is so important to monitor the balance and compare the numbers with the dynamics of the results regularly. You will notice that at some point the number of new and repeated impressions can reach a mark close to 50×50%, and after that the share of new impressions will begin to decline. This may not happen right away. You can see the First Time Impression Ratio in the amount of 10-20% and at the same time continue to get stable results, however, this is an indicator that the situation will change soon. New users don’t see ads, old ones are annoyed with it, and the growth of the cumulative frequency is increasing. The lower is First Time Impression Ratio sare, the higher is cumulative frequency: existing users cannot convert every time they see an ad.
It is impossible to say how many repeated impressions of an ad are the “golden mean”. The number of impacts on each user depends on different parameters that we wrote about above, so you should always look at the results. You can never know in advance where this “optimal” saturation point for advertising is located, but First Time Impression Ratio will signal about the border when the frequency can become a problem. Remember the main thing – the indicator is not linear, it may begin to hint at the presence of a problem when it is not there yet. Therefore, do not rush to turn off the campaign or make changes to it, as soon as you see ratio decrease, always focus on the change in cost per result.
Goal # 2 – Unit Economics
If you seek not only to minimize advertising costs but also to maximize profits from it, then your KPIs are measured by an increase in revenue (in another word – Value) and profitability. Thus, the evaluation of the campaign’s effectiveness is not limited only by the expenditure part and the measurement of the cost per action. We also analyze the revenue side by such indicators as ROAS, CLV and others. Value gives to the professionals more flexibility in decisions making when managing advertising campaigns, but requires experience and understanding how to analyze the revenue. At the same time, you can increase revenue both in the context of online and offline conversions.
What factors influence Value?
- Segmentation. Knowing which products have good margins, can help to increase profitability.
- Cross-sell and resale. If the user made a purchase, this is not a reason to stop and fell relief. You need to work on selling additional goods and/or returning customer for another purchase. So you can increase the average bill, profitability and revenue. Even if the price of the result rises, but the revenue part increases, you will get an increase in ROAS.
- Up-sell or down-sell. If the purchase did not take place and the retargeting for the product that was viewed did not change the situation, you can motivate the client to buy the version of the product/service at a higher price (Up-sell) than he originally was looking. Or lower, but with a higher margin (down-sell). The first option makes it possible to earn more than expected, and the second one to maintain a margin by selling goods at a cost more acceptable to the client but earning the same amount. This is possible for those, who know well the marginality of all products.
- Customer lifetime value. This is the profit that the client brings during the whole time of your “relationship” with him. This is a very important indicator for business in any field. Why? Users can make a purchase and never return to you again, or they can regularly buy your product or service, increasing the return on investment. But do not lose sight of the cost of attracting a client. It should not exceed the income from interaction with him, otherwise, you will not earn money.
To work with Value, it is important not to lose sight of the Unit-economy, which is able to answer the question “how much does your client cost”, and more precisely, calculate the income and expenses per user. It allows you to evaluate business indicators, analyze the overall results that a business already has, gives an understanding of what is being sold and how it is being sold, which goods/services are locomotive, etc. But to predict the unit-economic of the promotion channel that you have chosen for their own purposes, one cannot rely on general results. You need to collect data, implement your strategy, validate hypotheses, run ads, conduct testing and analyze the results.
Unit-economics will help you evaluate the effectiveness of sales channels, find a breakeven point, conduct tests to obtain relevant data, build forecasts and calculate the return on investment, scale and understand how many customers you need to attract and how much it will cost. When your goal is to increase revenue, this is extremely important information for the strategic planning of advertising activities. But for the calculations, you will need familiar parameters, such as CPA, Lifetime Value, Customer Acquisition Cost, Profit, etc.
Conclusion
It is important to evaluate the effectiveness of advertising based on two main parameters: the goals that you are facing and what your KPIs are measured in. Reducing the price of the result is a goal that every advertiser should strive for. However, if you put the revenue side at the head of the table, you can increase profit, which is sometimes easier to do than decrease the cost of the target action.
Business needs income! Provide good revenue and manage your advertising performance as a factor in the profitability of your advertising campaigns, but don’t put metrics as your primary goal. A cheap lead or another conversion that didn’t bring money to the business is not good. Performing such KPIs, you can simply ruin the business. Even if it becomes possible to show everyone a “cool” case with a low cost for the target action, is this approach a threat to the existence of the project as a whole?
Being business-oriented allows you to work more comfortably. Once we all tried to provide a cheap cost per click, but now, working with conversions, we get more expensive clicks, but a higher level of conversions. In the same way we work with the revenue side. Providing a high income, we continue to monitor expenses, trying to increase profitability, but not to reduce the cost of the target action.

Subscribe to our Messenger bot and Telegram channel to receive the most useful content about advertising on social networks.
If you have found a spelling error, please, notify us by selecting that text and pressing Ctrl+Enter.