
Content
Is your advertising not delivering the results you hoped for? ? With this clickbait headline, we invite you to thoroughly explore the metrics that influence the quality of advertising on Facebook, as well as the possibilities for their optimization.
PPC specialists and copywriters can spend hours refining that one flawless advertisement. The former meticulously select their target audience, ensuring that even if they don’t make a purchase, they won’t be inclined to complain about the ad. The latter harness all the language’s nuances to grab attention. Meanwhile, Facebook analyzes just three metrics that impact both your advertising budget and campaign results.
Types of Metrics
Metric 1. Quality ranking
This metric enables you to compare how users perceive your advertisement with others aimed at the same audience. It takes into account various parameters, ranging from feedback and complaints to the quality of visual materials and calls to action (such as liking or commenting).
Metric 2. Engagement rate ranking
This metric assists in comparing the anticipated engagement rate of your ad with others targeted at the same audience. It reflects the probability of a user interacting with your ad: clicking “See More” to read the full text, liking it, following a link, or sharing the post.
Metric 3. Conversion rate ranking
This metric helps compare the expected conversion rate of your ad with others aimed at the same desired optimization outcome and targeted at the same audience. It indicates the likelihood that a user who views your ad will achieve the desired conversion in optimization. For example, submitting a form on the website or adding a product to the cart, etc.
Each metric corresponds to a Rating Scale:
- Above average;
- Average;
- Below average (last 35% of advertisements);
- Below average (last 20% of advertisements);
- Below average (last 10% of advertisements).
What does the rating mean? For example, a “Below average (last 20% of advertisements)” quality rating means that your advertisement was rated the same as the last 20% of advertisements targeted at the same audience. However, the quality of 80% of the advertisements targeting the same audience was higher.
However, not all types of ads and optimization methods have access to these metrics.
The Quality Ranking isn’t applicable to dynamic creatives; its data is refreshed, reflecting results from the past 35 days.
Engagement Rate and Conversion Rate Rankings aren’t accessible for optimization strategies like “Ad Recall Lift”, “Impressions”, “Reach”, “Custom Conversions”, or “Value”.
Where to Find Metrics
You can view metrics at the ad level in Ads Manager under the “Performance” report. If they’re not there, chances are your ad hasn’t yet accumulated 500 views, and the information is currently unavailable.
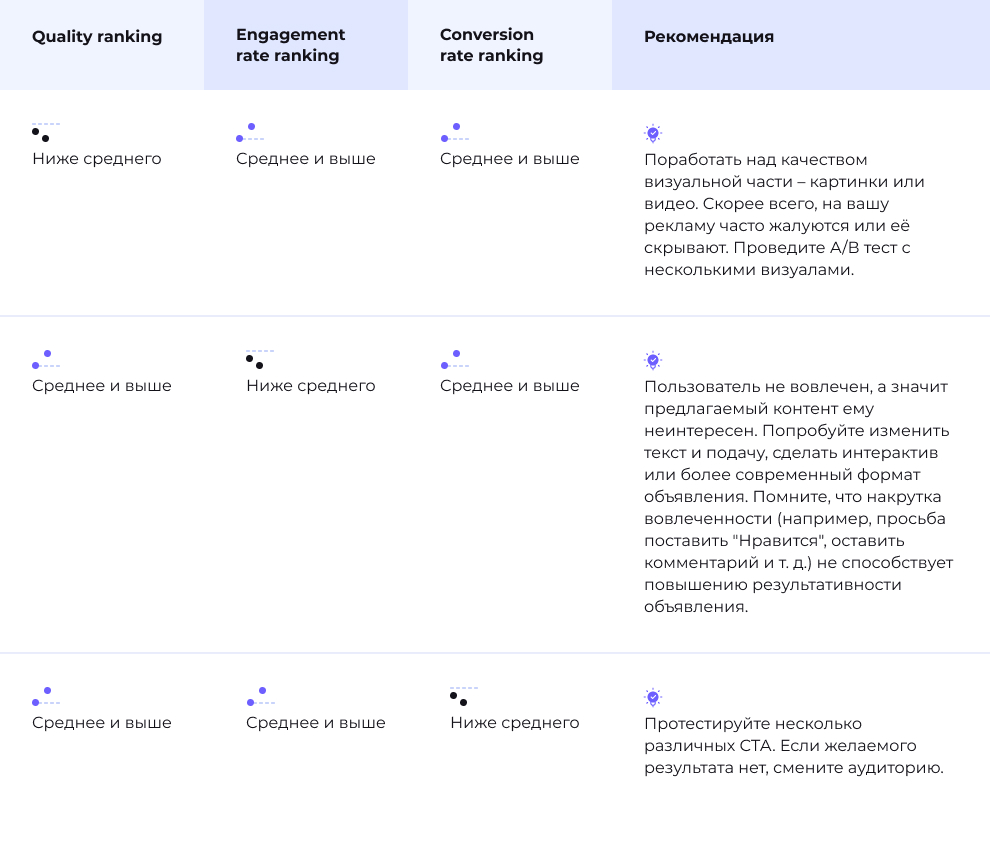
Tips for Improving Your Ads
As we’ve mentioned, metrics work together. So, if your ad isn’t performing as expected, take a comprehensive approach to analysis.
Here are some quick tips for common situations:
Key Takeaways
The better the quality of your ad, the more successful it will be in the auction, leading to a lower cost. Conversely, lower-quality ads tend to cost more and perform less effectively.
Moreover, if Facebook consistently identifies your ads as low-quality, it may extend this judgment to all ads from your page, domain, advertising account, and related sources.
Improving ad quality is essential for enhancing the performance of your advertising efforts.
Don’t forget to subscribe to our Messenger bot & Telegram channel for the latest insights on social media advertising.
If you have found a spelling error, please, notify us by selecting that text and pressing Ctrl+Enter.