Content
The e-commerce market in the CIS is one of the fastest-growing but the share of online trading is still small. In such conditions, online stores have to fight for the growth of the sales market, for their profitability, for an increase in the average check, profit, and conversions. In this article, we will share the case of promoting online store in the fashion segment, go through the main tools that influence KPI achievement, ROAS, and sales increase.
About the Project
In April 2019, we were contacted by the Brand-X, online leather footwear and handbag shop. Unfortunately, we cannot mention the name of the brand according to the NDA. The company faced a 30% sales drop across all channels, a lack of a strategy for launching and scaling advertising campaigns, and a lack of competent specialists to deal with this situation. The client set us a goal not only to return to the previous results but also to increase them providing KPI of $10 per sale.
Implementation
Since the main reason for the client’s concern was the sales drop, we started working on the project precisely with this task.
Sales Increase
After analyzing the client’s previous advertising activities, we that the reasons for the decline were as follows:
- CPM cost increase;
- usage of monotonous messages;
- situational promotion of posts;
- unfinished retargeting funnel;
- lack of a marketing model and general strategy.
This approach can bring results for a while, but in the long run, such tactics quickly exhaust themselves.
First of all, we began to work with various insights and behavioral factors of the audience to understand what type of creatives can engage the user and attract their attention. Since the client didn’t have a global communication strategy, we started creating one and developed a creative matrix.
Many argue that the main thing is to find the consumer’s pains. We don’t focus only on problems, since not only pain but also desires, opportunities and many other factors can influence the purchase decision process. We wrote a separate message and prepared a list of pictures, videos, buttons, and texts to test for each insight.
Working with Cold Traffic
After an evaluation of the client’s input data and product, we chose an emotional approach to communicate with the target audience using the principles of transactional analysis. Insights that worked with customer’s feelings after the purchase and their desire to possess a thing proved to be the best. For example: “This is a paradise for your feet. Check stylish shoes from Brand X. Choose your new pair on the website.” Creatives that offered a discount also worked perfectly: “Sale from Brand X is the best start to update your wardrobe. Add brightness and tenderness to your style. Brand X shoes and bags with the discount”.
The client’s products were clearly presented on all banners. The focus on the benefits of the purchase in conjunction with an attractive visual component worked in the best way.
Working with Warm Traffic
As for the warm traffic, here we took the standard approach and settled on the Collection from the catalog and the Carousel ads formats. The Collection immediately showed its effectiveness but the Carousel didn’t, so we stopped the last format and redistributed the budget.
Besides, we divided ad placements. In general, we are not fans of placement separation, but in this case, there was a need to understand:
- which placement works better;
- which ad format is cheaper;
- in which placement we should invest more to scale the result.
The budget allowed us to decompose detailed targeting for more precise testing.
Contrary to the claims that clothes, shoes, and accessories are sold better on Instagram, we got the opposite: in our case, Facebook showed better results and provided purchases in 2.5 times more in 3 months. The purchase price was $ 5.2, while on Instagram the cost per result was $6.9, which is also in 2 times lower than KPI. If a budget allows, sometimes it’s worth to test the effectiveness of placements.
Initially, we selected impressions on Facebook feed, Instagram Feed, and Instagram Stories. During the experiments, the last placement turned out to be the most expensive (2 times more expensive than KPI) and low-efficient, which is why we turned it off as a separate campaign. However, we combined this placement with impressions in feed. After that ad campaign began to meet KPI. Such results can be explained by the fact that after combining two placements, we got a larger sampling size and reduced CPM.
Analysis of Results
Working with Google Analytics made it clear that more than 70% of all purchases are made from mobile devices. That’s why we divided targeting of products from the catalog by the type of devices and started to display them on desktop and mobile separately. We lanched Collection ads for mobile version and Carousel ads from the catalog for the desktop. We’ve got few conversions on desktop devices, but they were expensive, so we set up Single Image format instead.
You have to make an effort to find a working model that produces results according KPI. However but without constant analysis of the results, trials, and experiments, it will be hard or even almost impossible to find one. Sure, this process costs a certain amount of time and money but, as a result, you will have a plan that brings stable results.
Retargeting Campaign Structure
Additionally, we established a retargeting with the substitution of communication. We addressed the actual message to each specific user who visited the site, no matter what stage of the sales funnel he left at. Retargeting helped us to “return” users who have already visited the site but haven’t completed the target action, as well as existing store customers, encouraging them to re-purchase.
If a potential client left online-store at the stage of adding product to the shopping cart, we reminded him about incomplete purchase. If he left looking at one of the sections of the site, we “caught him up” with information about the newest categories and a wide range of goods. In addition, we made two options for each creative: with a focus on the rational or the emotional component.
For example, a user who left while viewing a product card saw the following emotional message – “It seems we liked each other. Go to the site to learn more about the product. We have something to surprise you, so that you surprise others! Natural leather products at sweet prices.”. Here the rational one: “We have picked up even more products that you may like. Traditional quality from Brand X masters and genuine leather products will become your companions in any situation: a walk with friends, a date or a business meeting. Check a large selection on the site.” This gave us the opportunity to significantly increase the ad campaign conversion and to understand that rational ads win in this “competition”.
Our Results
As a result of all the actions described above for the period July-August 2019, we managed to:
- increase sales;
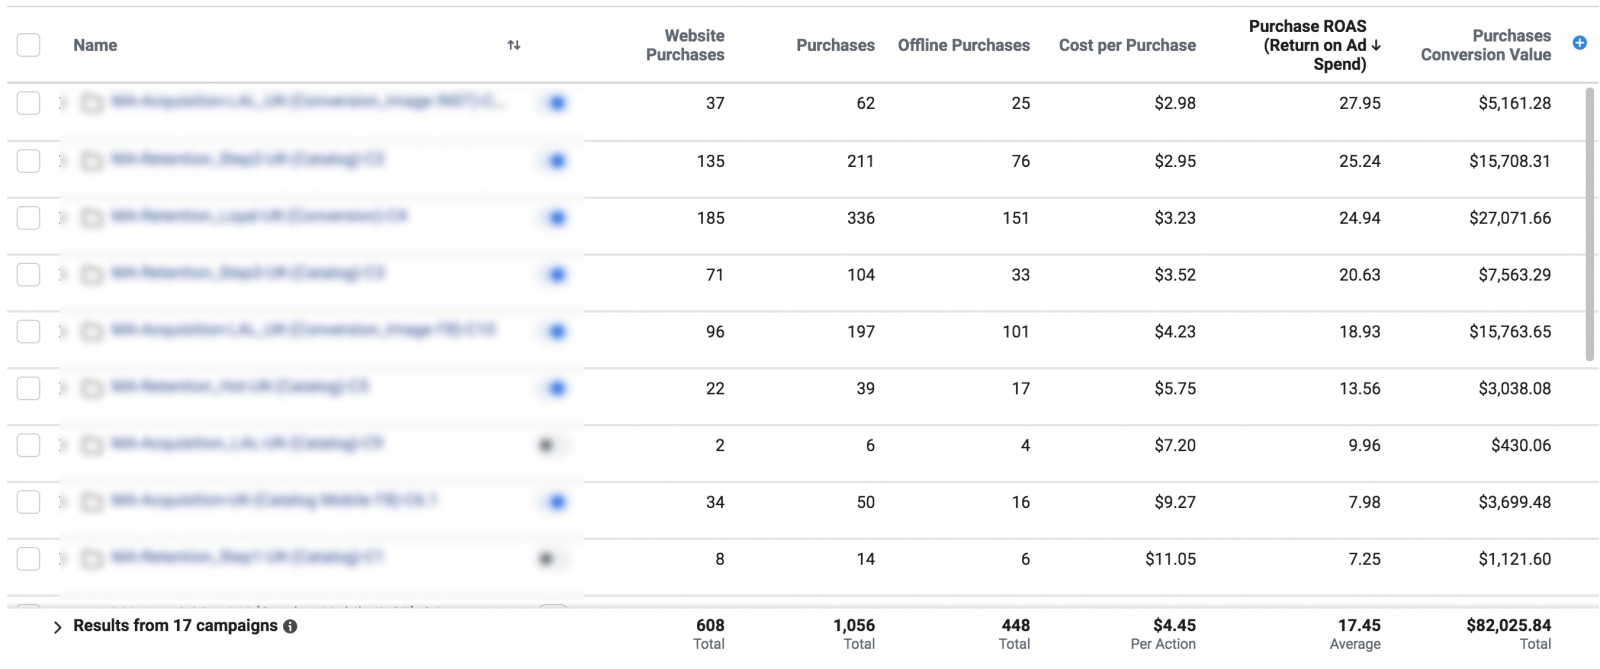
- achieve average ROAS 17.45 (at the beginning of the project this figure was equal to 7.9);
- and provide set KPI in $10 per sale.
After the conversation with the client and the analysis of the results, we realized that a large share of sales takes place offline.
Since the offline conversions automatic downloading wasn’t set up, we asked to provide us with a database of those customers who made a purchase via phone, Instagram Direct, and Messenger, as well as in the brand offline stores. Then we uploaded it as a CSV file to Facebook. The uploaded list must be linked to certain advertising campaigns that were launched in the respective period, and then the system automatically matches data. As a result, client’s e-mails, phones, purchase dates, and prices of goods were included in the analytics, After that, we immediately saw other numbers. That had happened because we “recorded” those clients who interacted with our advertising and decided to buy offline, but we still were able to objectively measure our own results. The cost of conversion decreased and the number of sales almost doubled.
Offline Conversion Tracking
Users who clicked or viewed the ad may not be able to make a purchase immediately. However, this does not mean that they should be forgotten and their further interaction with online store can not be tracked. By working with offline conversions, you can not only find the lost conversions but also:
- get information about target activities outside the online store;
- more accurately assess the effectiveness of sources of attraction of target audience;
- learn customer’s journey toward a purchase;
- evaluate advertising ROI;
- effectively manage targeting, thus getting more sales;
- find ads that often end up with conversions.
Since offline conversions automatic downloading wasn’t set up yet, we upload data manually. Facebook advises doing this often and regularly for a more successful match, including the attribution window of 1/28 days. We download data every 2 days.
Results for July-August 2019
Sales — 1056.
Online sales — 608.
Offline sales — 448.
KPI — $4.4 per sale.
ROAS — 17.45

Conclusions
- The synergy of online and offline conversions, if there are any, makes it possible to evaluate the results of ad campaigns and ROAS objectively and achieve the given KPI.
- Situative approach in advertising, which was at the head of client’s strategy before he came to us, can work. However, it will never give stable results. As well as it will not help to define working models of promotion for a particular business and goals.
- The development and testing of various insights gives an understanding of what communication tone and format will resonate with a potential client and lead to a purchase. Always try different creatives, texts, CTA, and ad formats, even when the key indicators are achieved. In our case, ads that had an emotional component performed better.
- With more data, including sales that have been made through various channels, Facebook is better aware of whom to show ads to. This is another reason not to forget about offline conversions and upload them into the system.
- By losing focus on simple tools, you can demonstrate non-objective results and incorrectly evaluate the effectiveness of your work. In our case, we are talking about offline sales, which composed to almost half of the total amount.
Despite the fact that we managed not only to achieve KPI but also to reduce the cost of the result, increase ROAS, and number of sales, we continue to make forecasts and build strategies. In the near future, we plan to start scaling, since the achieved results must be increased.
If you need help in promotion of your own e-commerce project, please contact us.
Subscribe to our Messenger bot and Telegram channel to receive the most useful content about ads in social networks.
If you have found a spelling error, please, notify us by selecting that text and pressing Ctrl+Enter.


