Content
Ad campaign structuring and manual tests can actually double a company’s ROAS. This is the result that we achieved with one of our recent clients. Learn the case of Krystellie Fashion, a brand with a strong focus on specific products.
You all know the story. A company runs ads, constantly receives an income, thinks that everything is working the way it should. Until the ad effectiveness wanes. This is the time for us, performance advertisers, to come and save the day.
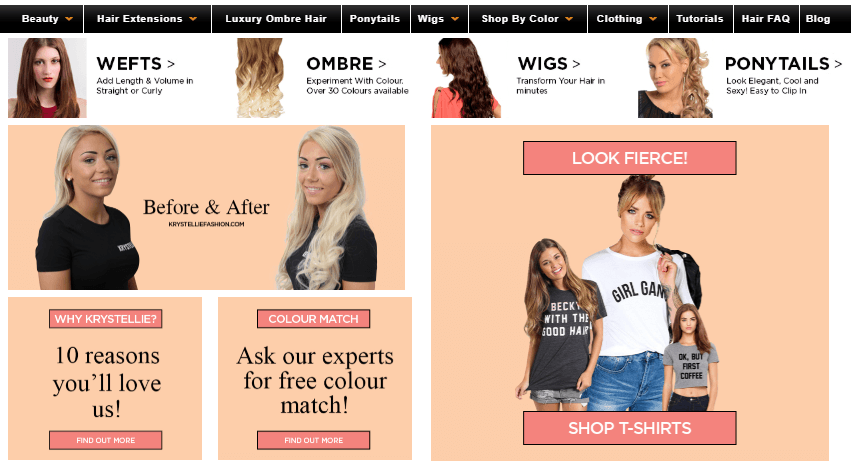
Krystellie Fashion is a British brand selling different products for women, including clothing, accessories and beauty products. In their promotion strategy, they specifically focus on selling hair clips and extensions. This category generates a lion’s share of purchases, approximately 90% of all turnover.
When their ROAS decreased by half year over year, they turned to us for help. We analyzed their problem, implemented the solution, and got impressive results. We managed to revive their ROAS, and here is how.
The Challenge
Krystelle is an online store that specialises in hair clips and extensions. Their ad activity generated an average ROAS at the mark of 3.5 in 2017. In early 2018, a Krystellie owner noticed a considerable drop in terms of ROAS: from 3.5 to 1.7.
The international eCommerce business is a highly competitive niche. The market is changing at a breakneck pace, and it proves to be quite of a challenge for the marketers to anticipate the trends.
As Krystelle’s return on the advertising activity was going down, it was facing a critical point. A lower ROAS value could have killed the business. So our goal was to bring ROAS back to the result above 2.0.
Our inputs to work with:
Business type: online store;
Segment: hair care;
Shop turnover: more than £1 mln per year;
ROAS: 1.7;
Ad Platform: Facebook & Instagram.
Our goal: to secure ROAS above 2.0.
Phase 1: Analysis
Before doing any actions, our data-driven agency always conducts research on the outset. In this case, the goal of our research was to ascertain the reason for the drop between 2017 and 2018.
A deep analysis of the current brand’s advertising activity let us detect an issue. We noticed that since 2017 the CPM increased twofold. All other circumstances haven’t changed. So the reason for CPM going up could be increased competition in bidding, a lack of structure, ad fatigue and so on.
For an advertiser, it meant that you had to spend more to get each purchase. For Krystellie Fashion, this created an over-expenditure leading to a considerable decrease in sales.
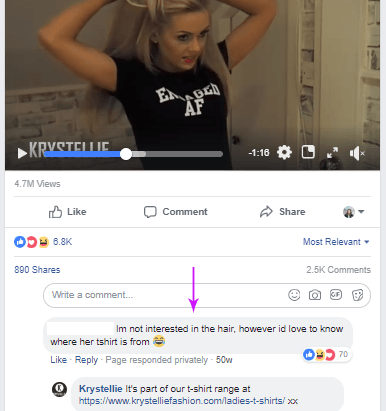
Apart from expensive CPM, we noticed that Krystellie has limited itself to acquisition campaigns. Krystellie didn’t use any cross-sell/upsell strategy and focused on hair products only. With that, they had other product categories, which could be promoted to increase an average product cart.
Phase 2: Improving the traffic structure
As our first step, we divided the campaign traffic structure to include both Acquisition and Retention activity.
Acquisition
The challenge here was to attract relevant users and convert them into real customers.
To find what could work well, we drafted and tested different hypotheses. Our acquisition campaign structure looked as follows:
‣ Relevant Interests / Behaviour
‣ Customers LAL 0-1 %/ Customers LAL 1-2 % / Customers LAL 2-3 %
‣ Post Ad Engagement / Facebook Fans
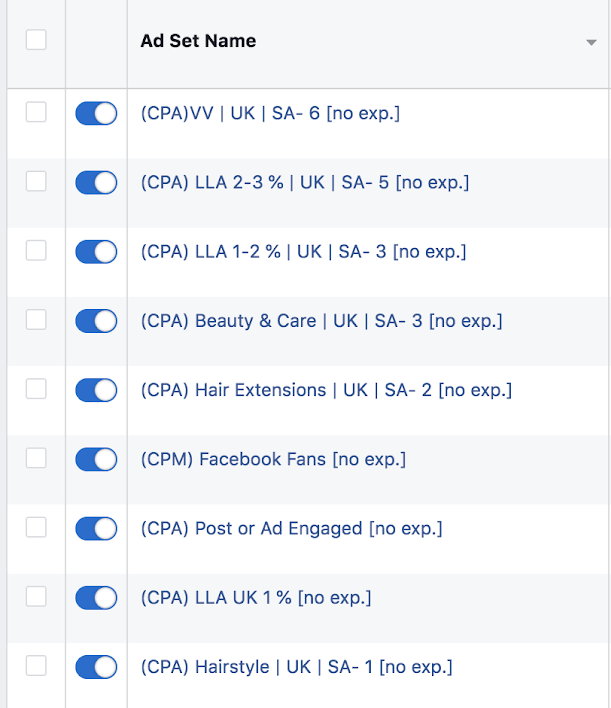
Each of the aforementioned audience groups has been assigned an ad set. This allows us to find the best performing ad set within a particular acquisition campaign. We could then eliminate those with the lowest performance and allocate more budget to the successful options.

This approach helped us achieve an increase in ROAS even at the acquisition stage.
Retention
To secure the retention of a warm audience, we built a retargeting model based on the sales funnel of this specific online store.
In the support of this model, we also:
• identified the funnel stages;
• prepared a relevant message for each stage;
• set the time frame for each stage;
• introduced the Dynamic Product Ads to the general promotion strategy.
Our main challenge here was to ensure for the potential clients to move forward along the sales funnel to the final conversions, as well as come back later for repeated purchases.
Retargeting campaign structure
To build the relevant funnel stages, we studied the traffic map and identified the following customer journey:
- Main Page
- Product Category
- Product Card
- ATC
- Checkout
- Purchase
Following these stages, we could draw traffic along the funnel to the main goal.
To manage the traffic effectively, we assigned each funnel step a separate ad set. We also performed all needed exclusions – each next audience group has been excluded from a previous one. So here is our final retargeting ad campaign structure:
- Main Page Visitors, excluding product category visitors.
- Product Category Visitors, excluding product card visitors.
- DPA: Dynamic Product Ads.
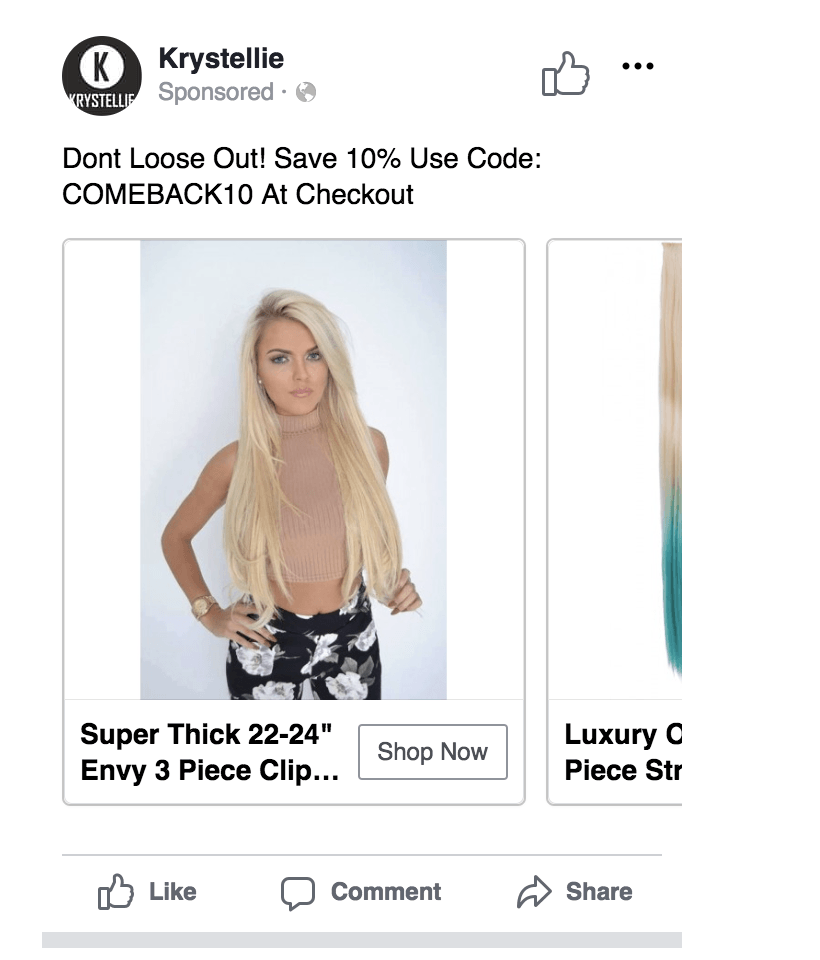
Dynamic ads make it possible for an online store to connect its product catalog to the system, and let it find the right users for each product. The prices and availability are kept up-to-date automatically.
We decided to use dynamic ads to target people who visited product cards or added some items to cart. This way, we could show users the most relevant products, bypassing the heavy manual settings.
Communication strategy
Once we had our division of the audience groups, our next step was to find a fitting message for each of these groups.
1) We showed Carousel Ads with different product categories to people, who didn’t go further from entering the main page.
Such approach allows to show the website’s categories, which a user misses by bouncing away at the first step.
The main idea is to draw all website users further to product categories.
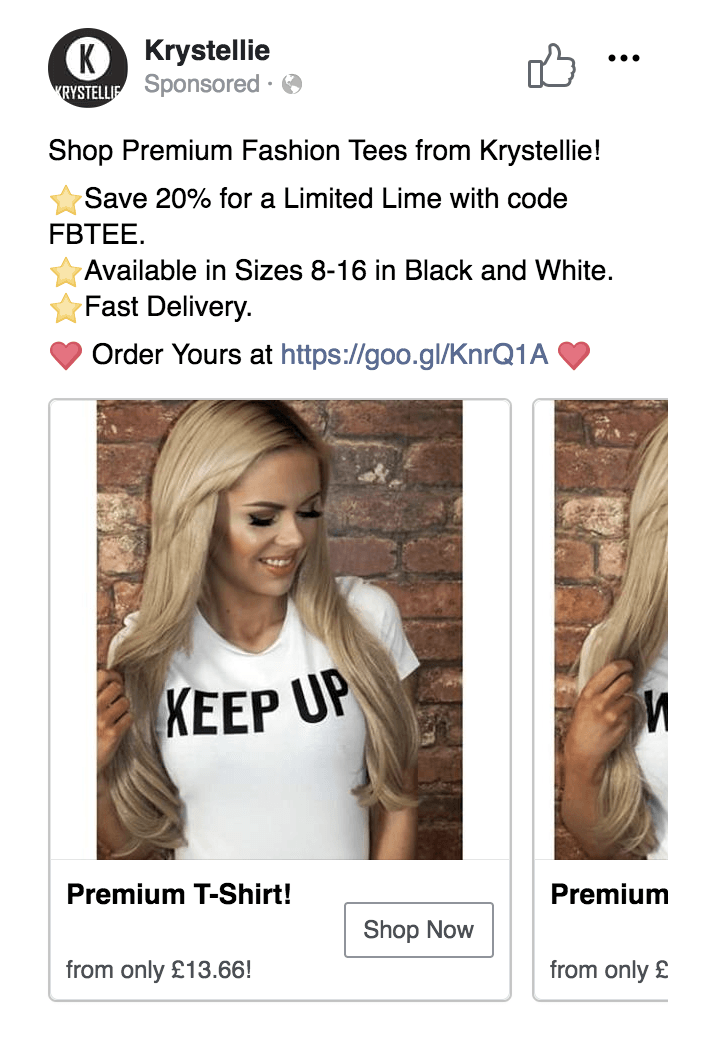
2) Visitors of a certain product category have been shown the bestseller products in this category.
The main idea: If a user has demonstrated an interest in a product category, we can then show the top products to attract this user back to the website.
3) DPA were shown to users, who have reached the events Product Card View and Add to Cart. DPA allow to return visitors automatically. The delivery of dynamic ads starts, as soon as a user reaches the “Product Card” step.
Making the schedule
After we knew what users will see what message, we had to make a schedule so that we don’t waste our budget on the attempts to reach the cooled down leads.
To define a time period for the retargeting ads, we used Cohort Analysis. Such analysis helps advertisers to understand the following:
a) Customer decision-making cycle;
b) Website visitors retention index.
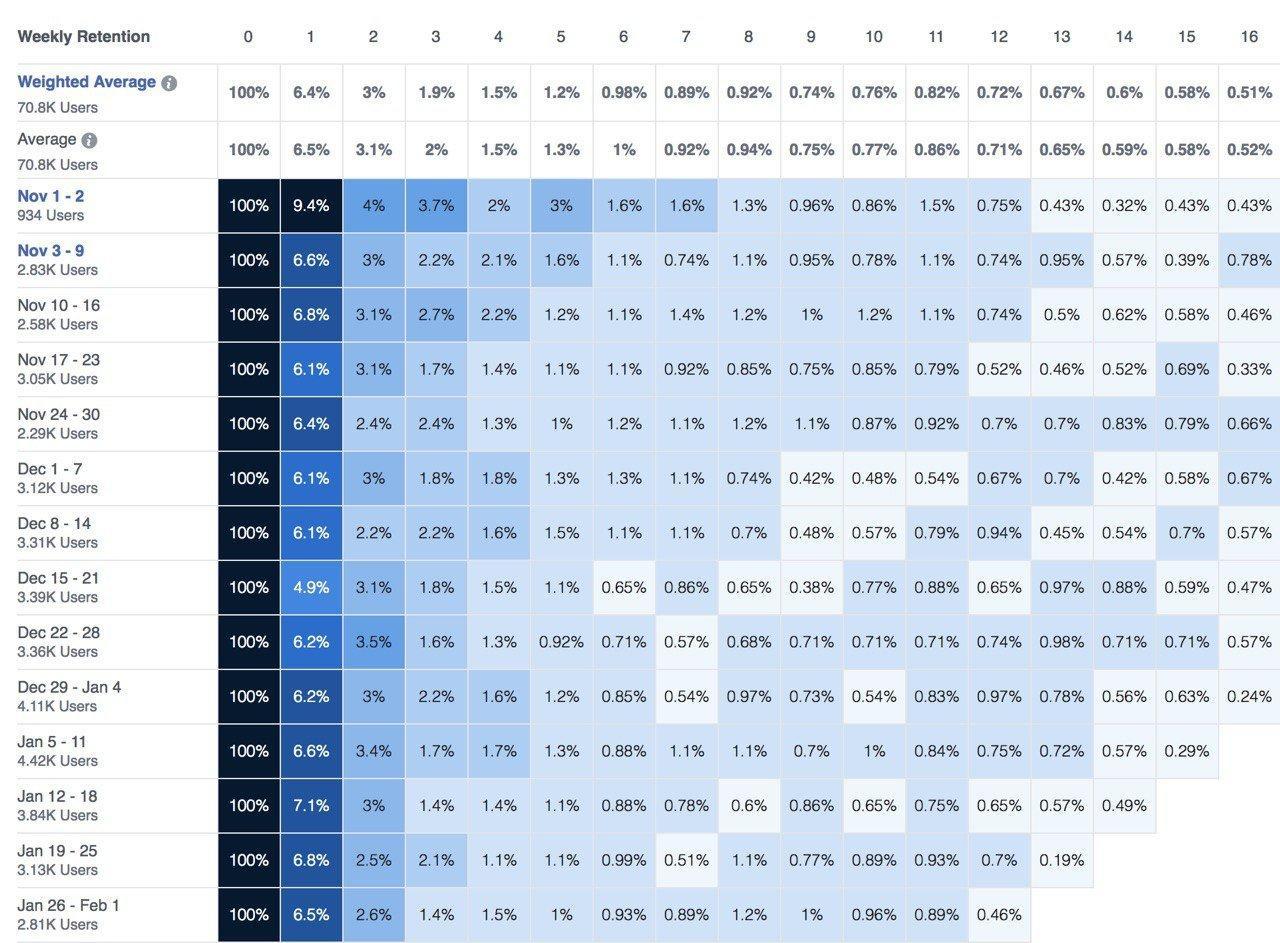
We’ve used these data to schedule the retargeting ad activity and set the time periods:
People who visited the Main Page but did not go further: 7 days retargeting audience.
People who visited Product Category but did not go further: 7 days retargeting audience.
DPA: 14 days retargeting audience.
The structure we had built in advance let us easily monitor the efficiency and finish with the result above our expectations.
Our Results
All the efforts in creating a retargeting system did pay off. It was all due to our preliminary analysis and the strategy, which was tailored to the given case. That is why we always ask our clients to fill the brief and let us know as much as possible in advance.
In this case, we had some pretty amazing results with the 10.18% funnel conversion rate. Detailed retargeting allowed us to reduce a drop at each stage of the sales funnel.
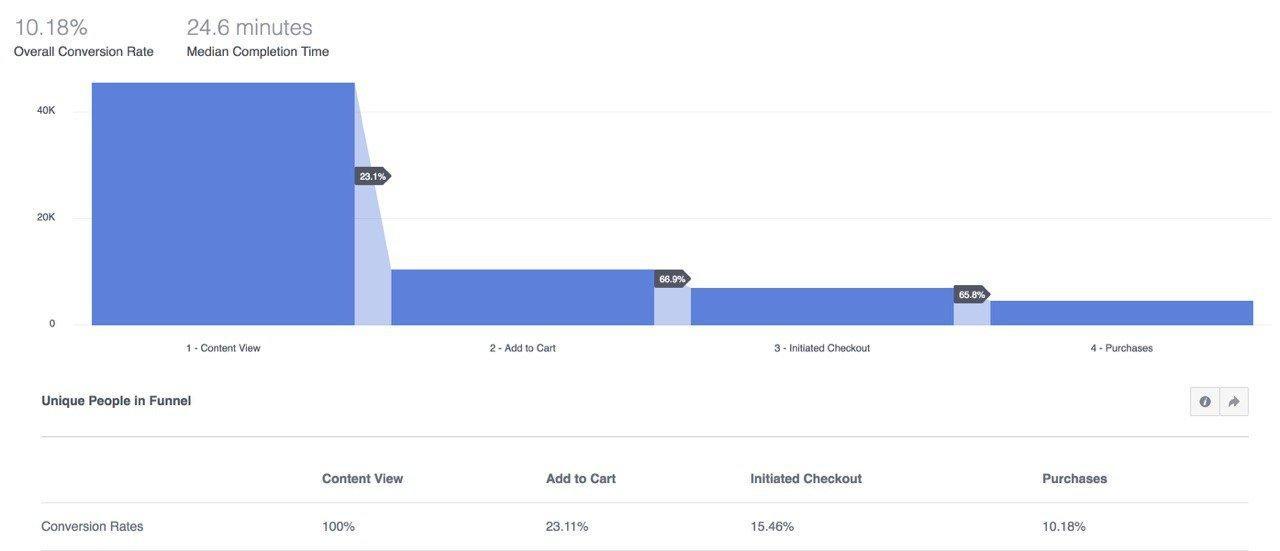
Our final Facebook ads results in numbers:
• Ad Spend: 33,071 £
• Website Purchase Conversion Value: 116,438 £
• Total Purchases: 5190.
This leaves us with the ROAS 3.52, which is far above our 2.0 starting goal. Krystellie’s return on ad spend rose from 1.7 back to where it was a year ago.
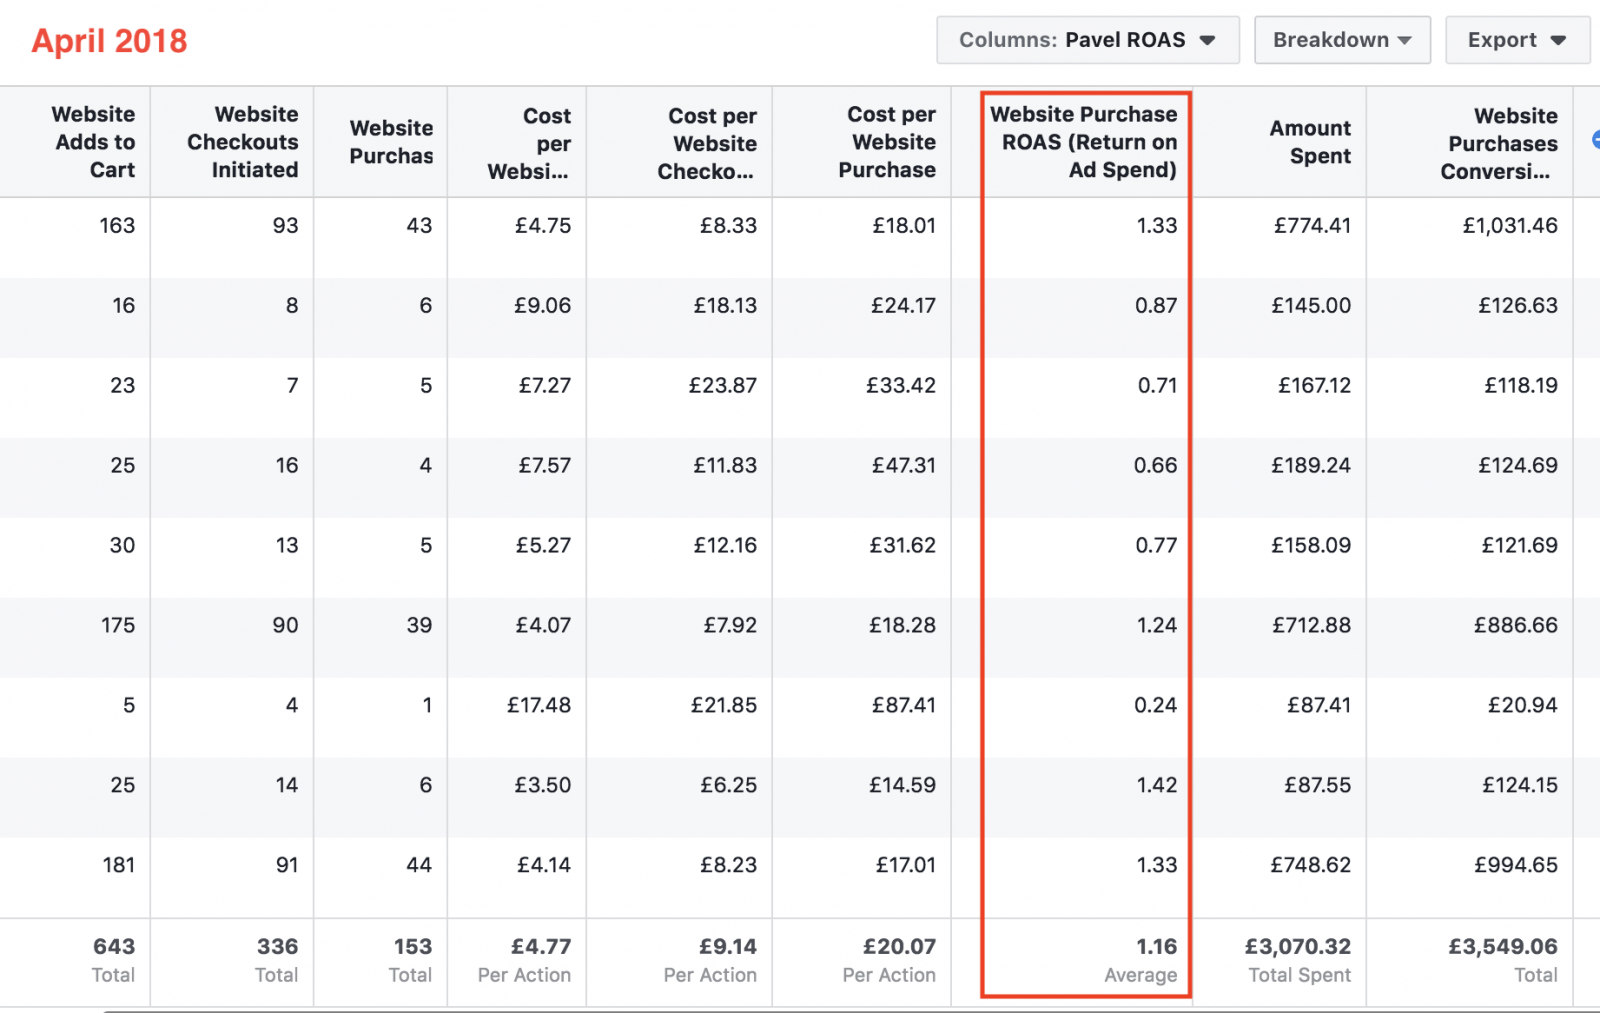
Here are the statistics as of April 2018 and May 2018 in comparison.
At the start:
At the finish:
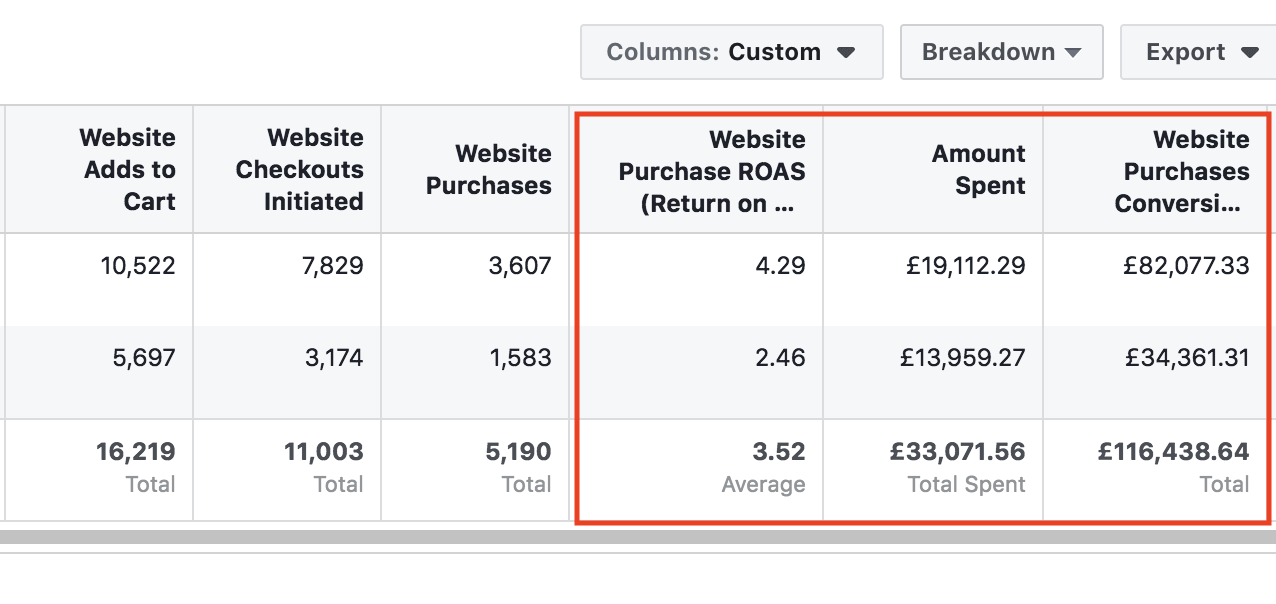
ROAS has been doubled in the course of a 3-month ad campaign. The goal has been reached. But it wasn’t our only achievement.
While ROAS was going up, we could also scale the campaigns. Our monthly ad budget went from £3K a month to over £33K against the positive dynamics in performance. The structure we’ve built let us scale, spend more on advertising and receive more from sales.
As a result of our work, the business was saved. Introducing the retention phase and building the communication around the actual customer flow helped us ensure the final sales. Dynamic Product Ads as a newly implemented solution helped to promote a wider range of products and prompt the converted users to return for the repeated buys.
If you have found a spelling error, please, notify us by selecting that text and pressing Ctrl+Enter.


